انتشار:
Jan 2024
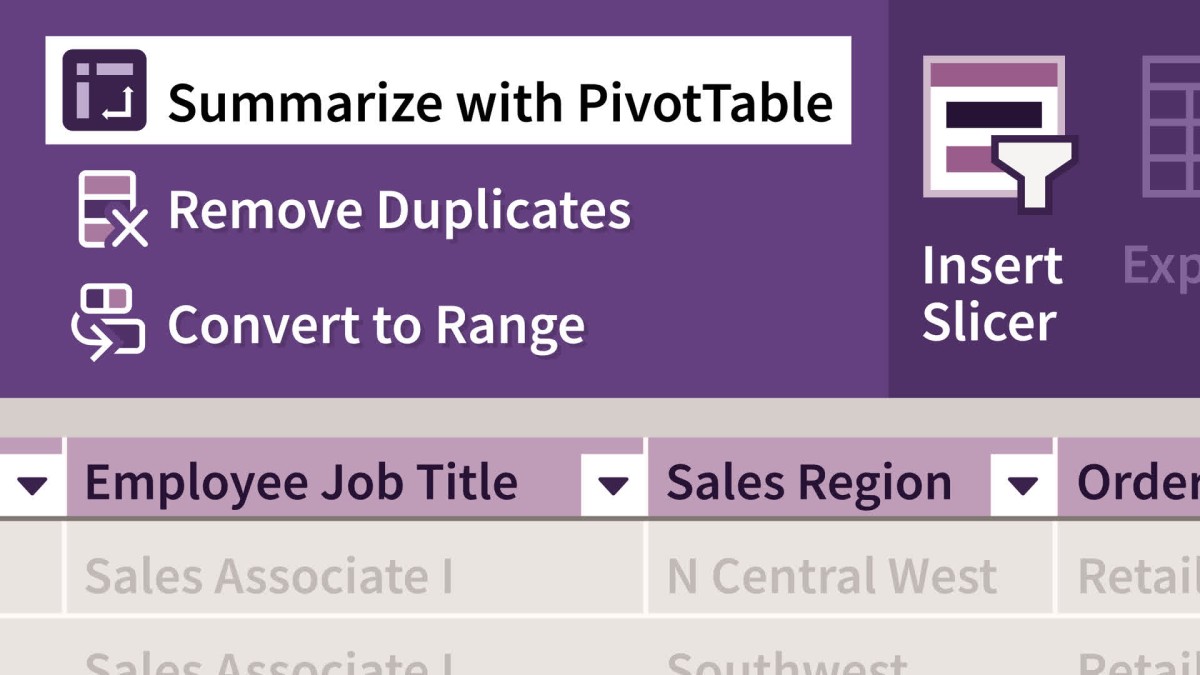
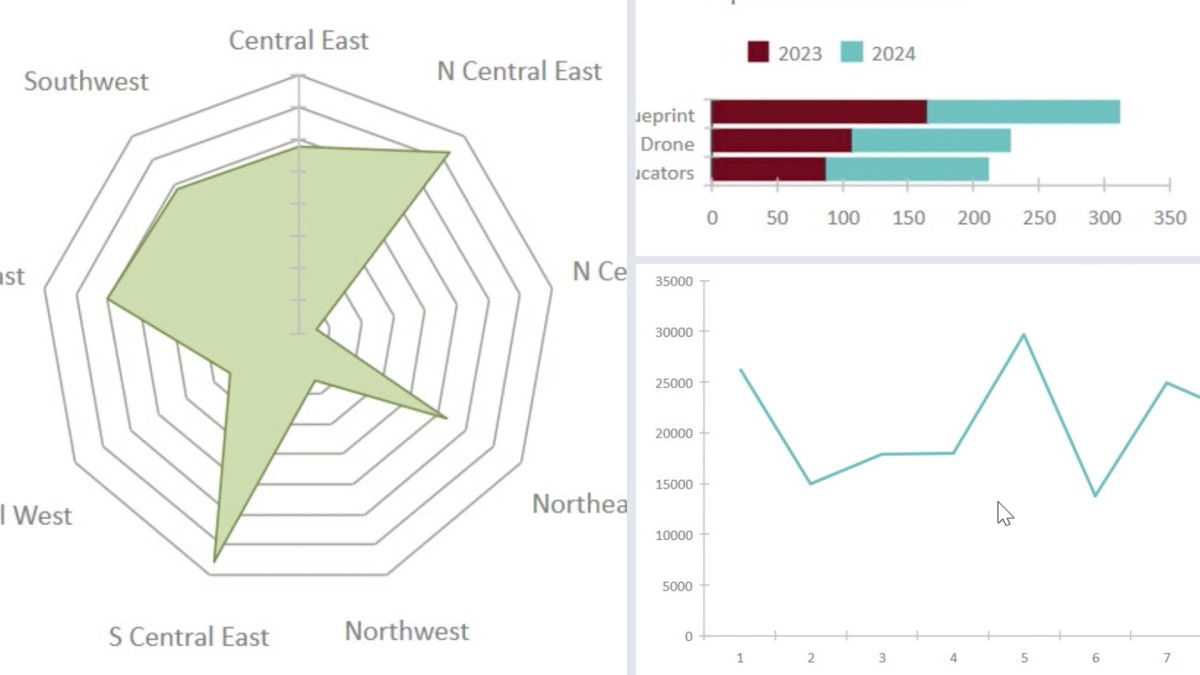
آموزش اکسل: نمودارها و نمودارها در عمق

مدرس
Jordan Goldmeier
انتشار
2024/01/08
مدت زمان
2h 11m
سطح
مناسب همه
فایل تمرینی
دارد
دانلود فایل فشرده
با توجه به امکانات آموزش و همچنین امکانات بسته انتخاب شده لینک دانلود فایل فشرده آماده خواهد شد. با در نظر داشتن این شرایط لطفا بسته مورد نظر خود را انتخاب کرده و روی دکمه درخواست لینک دانلود کلیک کنید
در حال به روزرسانی اطلاعات
درخواست لینک دانلود
در حال به روزرسانی اطلاعات
لطفا قبل از فعالسازی لینک دانلود به موارد زیر توجه کنید:
- پسورد فایلهای فشرده است.
- لینکهای آماده شده تا 8 روز پس از فعالسازی منقضی خواهند شد.
- حجم فایلها تخمینی هستند.
- در صورتی که لینک دانلود تا 15دقیقه پس از درخواست آماده نشد، از بخش پشتیبانی پیگیری نمایید.
محتواها
44 محتوای ویدئویی
زیرنویس
English و فارسی-ماشین
کیفیت ویدئوها
فقط
1080p
فایل تمرینی
دارد
آزمون
40 سوال
آموزش های مرتبط


3h 51m
•
2023

3h 25m
•
2023
3h 53m
•
2024

1h 32m
•
2023

1h
•
2024

1h 16m
•
2023
1h 40m
•
2025