Excel Tips: New This Week
Powerful uses of the new COPILOT function with other Excel functions
()
Previous Episodes
Accentuating Positive/Negative values with Conditional Formatting
()
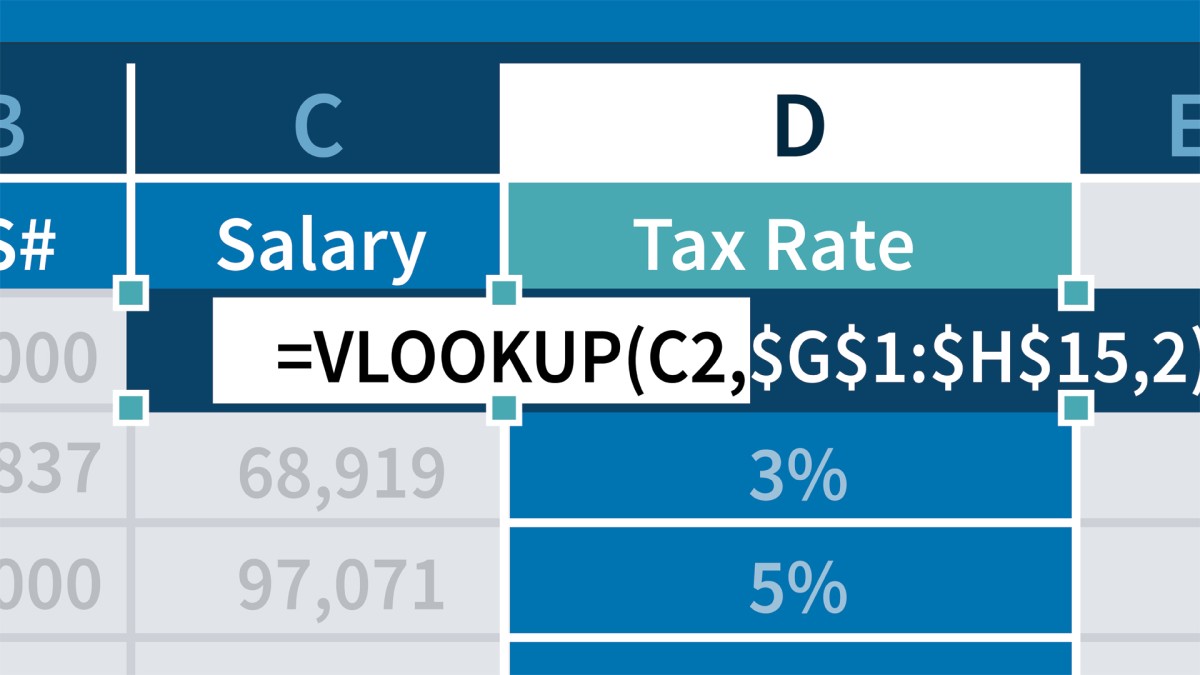
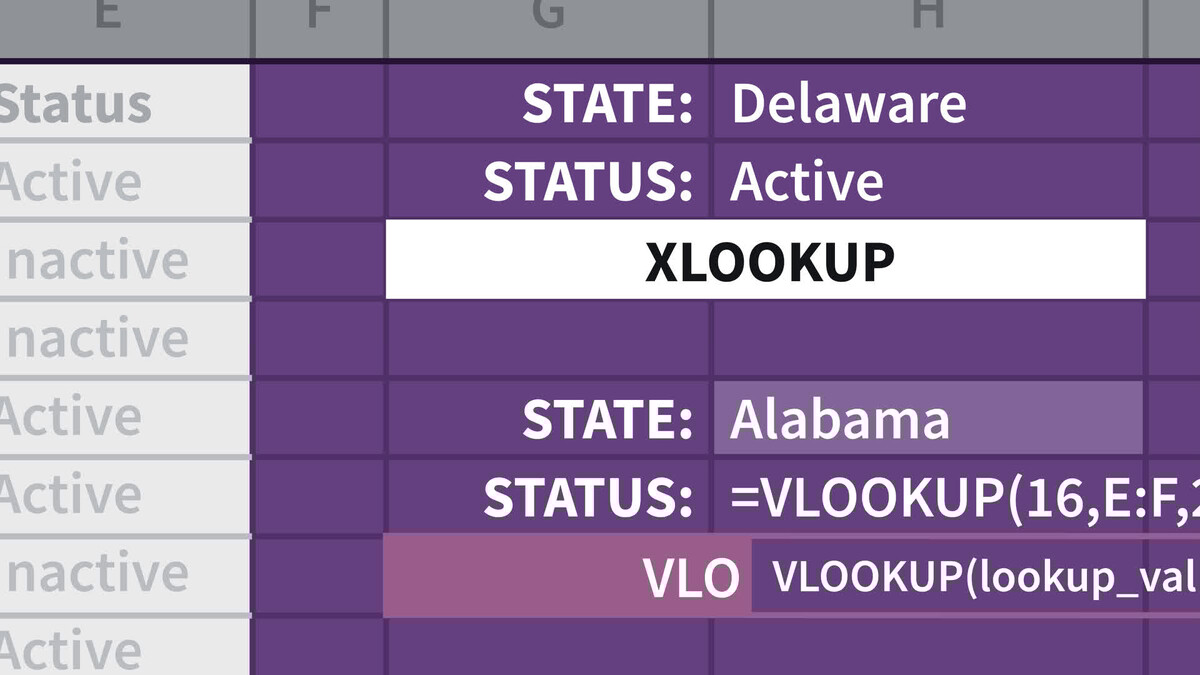
Using the XLOOKUP, VLOOKUP, and HLOOKUP functions for approximate matches
()
Update and alter numeric data using Paste Special options instead of formulas
()
Filtering Tables using slicers and the AGGREGATE function
()
Accelerate data entry with a variety of special techniques
()
Utilize AI tools to analyze your data with the powerful Copilot feature
()
Rearranging data with TOROW/TOCOL and WRAPCOLS/WRAPROWS functions
()
Creating dynamic charts with in-cell conditional formatting
()
How to use date functions: TODAY, NOW, YEARFRAC, and DATEDIF
()
Using date and time as metrics in a PivotTable
()
Using Pick list, XLOOKUP, Table, and Chart together
()
Using the new COPILOT function to clean up and categorize your existing data
()
Calculating unusual workday patterns with WORKDAY.INTL and NETWORKDAYS.INTL
()
Use Data Validation rules to prevent duplicate entries in a range
()
Using the REPT function for in-cell charting and other number display variations
()
Use Scenario Manager to store and rapidly recall different sets of values
()
Use SWITCH, IFS, and CHOOSE functions, contrasted with XLOOKUP
()
Collapse and expand column and row totals with the Excel AutoOutline feature
()
Altering the left-right order of columns with SORTBY, CHOOSECOLS, and the Sort command
()
Discovering time-saving tools in the Go To Special feature
()
Exploring various Information functions: ISTEXT, ISFORMULA, ISBLANK, and more…
()
Using list boxes and combo boxes to facilitate forms creation
()
Use the TEXTSPLIT function to split data based on one or more characters
()
Using the UNIQUE function when the FILTER function is using multiple AND or OR criteria
()
Creating PivotTables from data on different worksheets or workbooks
()
Chart efficiency tips: Create, transpose, add titles, adjust gap width, change layouts
()
Using data validation and the MROUND function to limit time entries to specific intervals
()
Working with Page Break Preview options
()
Using the Analyze Data command (formerly IDEAS button) on the Home tab
()
EOMONTH, EDATE, and related date functions
()
Displaying cell contents in specific chart type, chart titles, and text boxes
()
Using the Advanced filter for unusual filtering and creating unique lists
()
Creating linkage formulas using different worksheets and different workbooks
()
Using 2-digit year entries and adjusting to the 2029 date switch boundary
()
Using FIND, MID, TEXTBEFORE, and TEXTAFTER functions to extract text data
()
Group PivotTable data in different time frames, year, quarter, month, week, and more
()
New TRANSLATE and DETECTLANGUAGE functions uses with foreign languages
()
Working with hidden and visible data in filtered and subtotaled lists
()
Exploring TAKE function capabilities, like replacing the INDEX function
()
Exploring 12 overlooked database functions
()
Contrasting uses of borders and gridlines in displays and printouts
()
Creative and powerful uses of the SEQUENCE function for quick list creation
()
Exploring Excel settings under the File Options General command
()
Conditional Formatting with the INDEX and XMATCH functions
()
Creating and manipulating shapes using the Shift, Ctrl, and Alt keys
()
Working with Excel's new TRIMRANGE function and trim references
()
Accelerate copy/move/insert tasks with dragging techniques
()
Create Custom Lists for specialized sorting and quick data entry for lists
()
Exploring the new Focus Cell on the View tab
()
Use the PIVOTBY function to aggregate values by row and column fields
()
Using the Alt key for for faster menu access and for command shortcuts
()
Calculating with hours, minutes, and times of day
()
Use the new Check Box tool with conditional formatting for dynamic displays
()
Using the GROUPBY function to create a summary of list data via formulas
()
PMT and FV functions: Calculating monthly payments and earnings
()
Use Excel's various count functions: COUNT, COUNTA, COUNTBLANK, and more
()
Insert stock 3D models; move and resize similar images; rotate along three axes
()
Create custom number formats: Display leading symbols, in thousands or millions
()
Using the Allow Edit Ranges command to control cell editing by various users
()
Using Flash Fill to automatically fill in data based on patterns
()
Manipulating PivotTable layouts using Subtotals and Report Layout commands
()
300_Managing_Duplicate_Data.zip
(180 KB)
297_Date_Formats.zip
(15 KB)
301_New_Data_Types.zip
(322 KB)
298_Cell_Precedents.zip
(32 KB)
299_Date_Controls_with_Data_Validation.zip
(17 KB)
302_FILTER_and_UNIQUE_functions.zip
(57 KB)
303_UPPER_lower_Proper.zip
(14 KB)
304_Custom_Filter.zip
(80 KB)
26_01_Column_and_Bar_Charts.zip
(34 KB)
26_02_Powers_and_Roots.zip
(25 KB)
26_03_ISTEXT_ISNUMBER_ISNONTEXT.zip
(480 KB)
26_04_Function_Names.zip
(105 KB)
26_05_SUM_SUMPRODUCT_SUMIF.zip
(1.4 MB)
26_06_Binary_Octal_Decimal_Hexadecimal.zip
(40 KB)
26_07_Numeric_Formatting.zip
(21 KB)
26_08_Dates_and_the_1930_2029_split.zip
(12 KB)
26_09_Wildcard_lookups_XLOOKUP_and_XMATCH.zip
(99 KB)
26_10_Slicers_Analysis.zip
(136 KB)
26_11_Heat_Maps.zip
(61 KB)
26_12_Validation_with_UNIQUE_and_SORT_functions.zip
(61 KB)
26_13_Clustered_vs_Stacked_Chart_Types.zip
(44 KB)
27_01_XLOOKUP.zip
(163 KB)
27_02_Update_Date_Entries.zip
(118 KB)
27_03_Eliminate_Spaces_and_Special_Characters.zip
(17 KB)
27_04_Create_Range_Names_From_Headings.zip
(20 KB)
27_05_Date_Series_Creation.zip
(12 KB)
27_06_LAMBDA_Function.zip
(72 KB)
27_07_Goal_Seek.zip
(316 KB)
27_08_Sort_by_Custom_List.zip
(81 KB)
27_09_INDIRECT_function.zip
(25 KB)
27_10_Holiday_Calculations.zip
(21 KB)
27_11_Paste_Special_Drag_Options.zip
(300 KB)
27_12_SS_Numbers.zip
(96 KB)
28_01_Five_Invaluable_Keystroke_Shortcuts.zip
(167 KB)
28_02_New_Formula_Techniques.zip
(268 KB)
28_03_Time_differencees.zip
(48 KB)
28_04_Zoom_Techniques.zip
(81 KB)
28_05_Outlining_Tools.zip
(207 KB)
28_06_Analyze_Data.zip
(258 KB)
28_07_UNIQUE_Unique_vs_Distinct.zip
(51 KB)
28_08_Screen_Snip.zip
(1.2 MB)
28_09_Sunburst_Charts.zip
(667 KB)
28_10_Shadow_Glow_Reflection.zip
(854 KB)
28_11_Printing_Tips.zip
(79 KB)
29_01_Data_Validation_Multiple_Criteria.zip
(15 KB)
29_02_Quick_Access_Toolbar_QAT_Tips.zip
(36 KB)
29_03_Treemap_Charts.zip
(666 KB)
29_04_Quick_Analysis_Button.zip
(171 KB)
29_05_Dragging_Number_Cells.zip
(13 KB)
29_06_Analyze_Sales_using_the_IF_MAX_and_COUNTIF_functions.zip
(22 KB)
29_07_Hide_Unhide_Worksheets.zip
(616 KB)
29_08_Fill_Justify_Re_wrap_text.zip
(17 KB)
29_09_Date_Series_15th_and_Month_End.zip
(11 KB)
29_10_Filling_Blank_Cells.zip
(106 KB)
29_11_Sparklines_and_Conditional_Formatting.zip
(16 KB)
29_12_Transpose.zip
(23 KB)
30_01_Emojis_and_Pictures.zip
(408 KB)
30_02_Advanced_Filter.zip
(173 KB)
30_03_Combo_Charts.zip
(14 KB)
30_04_MID_SEQUENCE_LEN_Functions.zip
(489 KB)
30_05_PivotTable_Settings.zip
(78 KB)
30_06_Navigation.zip
(568 KB)
30_07_DATEDIF_Function.zip
(108 KB)
30_08_Word_Art_Transform.zip
(198 KB)
30_09_Dates_Months_Weekdays.zip
(158 KB)
378_TOROW_and_TOCOL_functions.zip
(17 KB)
IMAGE_Function.zip
(143 KB)
31_12_Conditional_Formatting_Icons.zip
(142 KB)
31_11_Multiple_PivotTables_from_one_source.zip
(53 KB)
31_10_SUMIF_and_SUMIFS.zip
(53 KB)
31_09_Picture_Links.zip
(74 KB)
31_08_Data_Validation.zip
(112 KB)
31_07_Moving_Average.zip
(16 KB)
379_Formulas_with_hidden_rows.zip
(377 KB)
31_06_SORT_and_FILTER_Functions.zip
(178 KB)
31_04_Replace_Formats.zip
(115 KB)
31_03_Dependencies.zip
(528 KB)
31_02_Formulas_Changes.zip
(71 KB)
31_01_Gridlines_On_Off.zip
(15 KB)
30_13_Stock_Charts.zip
(1.5 MB)
30_12_TREND_and_GROWTH.zip
(18 KB)
30_11_XLOOKUP_Solutions.zip
(23 KB)
30_10_Linkage_Formulas.zip
(22 KB)
31_05_Option_Buttons_and_Check_Boxes.zip
(29 KB)
380_Bubble_charts.zip
(17 KB)
381_CONCAT_TEXTJOIN_TEXTSPLIT_functions.zip
(18 KB)
382_Shrink_to_fit_options.zip
(108 KB)
383_Precedent_Cells.zip
(394 KB)
384_Formula_editing.zip
(84 KB)
385_Status_Bar_Control.zip
(94 KB)
386_Sorting_Tips.zip
(104 KB)
387_TEXTBEFORE_TEXTAFTER.zip
(22 KB)
388_Quick_Chart_Titles.zip
(357 KB)
390_TAKE_DROP_FILTER_SORTBY.zip
(227 KB)
391_Pivot_Table_Detail.zip
(134 KB)
392_Right_click_Filtering.zip
(663 KB)
393_WRAPROWS_and_WRAPCOLS_Functions.zip
(33 KB)
394_Dates_and_Times.zip
(61 KB)
395_Creating_Charts_Quickly.zip
(18 KB)
396_CHOOSEROWS_and_CHOOSECOLS_Functions.zip
(70 KB)
397_Decimals_Rounding_Formulas.zip
(9 KB)
398_Pivot_Table_Formatting.zip
(190 KB)
399_DB_Functions.zip
(125 KB)
400_Pie_Charts.zip
(17 KB)
401_Quick_Sorting.zip
(156 KB)
402_Charts_to_Pictures.zip
(429 KB)
402_Tracking_Cell_Types.zip
(544 KB)
403_BYROW_and_BYCOL_Functions.zip
(185 KB)
404_Formula_Shortcuts.zip
(769 KB)
405_3_D_Column_and_Bar_Chart.zip
(56 KB)
406 _VSTACK_and_HSTACK_functions.zip
(61 KB)
407_Calculating_by_Day_of_the_Week.zip
(173 KB)
408_XMATCH_and_XLOOKUP.zip
(12 KB)
409_Select_Cell_Ranges.zip
(158 KB)
410_Inserting_Symbols.zip
(143 KB)
411_Using_IS_Information_functions.zip
(66 KB)
412_Using_LEFT_MID_TEXT_functions.zip
(43 KB)
413_Edit_Go_To_Options.zip
(214 KB)
414_Fiscal_Year_Calculations.zip
(76 KB)
415_SORT_Left_Right.zip
(112 KB)
416_Conditional_Formatting_Analysis.zip
(26 KB)
417_Indenting.zip
(31 KB)
418_FILTER_AND_OR_Functions.zip
(112 KB)
419_Shapes_Linked_to_Worksheet_Cells.zip
(26 KB)
420_Slicers_with_Charts.zip
(48 KB)
421_Sort_by_Day_of_Month.zip
(92 KB)
422_Wildcards.zip
(106 KB)
423_FIND_SEARCH_COUNT_Functions.zip
(64 KB)
424_Histogram_Charts.zip
(125 KB)
425_AND_and_OR_Functions.zip
(66 KB)
426_Flipping_Lists.zip
(83 KB)
427_TEXTJOIN_CONCAT.zip
(18 KB)
428_Excel_Options.zip
(199 KB)
429_Alt_key_shortcuts.zip
(525 KB)
430_COUNTIF_family.zip
(58 KB)
431_Scatter_XY_Charts.zip
(174 KB)
432_Tracking_Data_Validation.zip
(78 KB)
433_AGGREGATE_Function.zip
(324 KB)
434_Duplicate_Data.zip
(88 KB)
435_SEQUENCE_Function.zip
(17 KB)
436_Tables_Validation_XLOOKUP_Chart.zip
(20 KB)
437_Stacked_Column_and_Area_Charts.zip
(65 KB)
438_FILTER_SORT_and_CHOOSECOLS_functions.zip
(758 KB)
440_New_Office_Theme.zip
(3.2 MB)
441_TOCAL_LARGE_SMALL.zip
(60 KB)
442_Chart_Quick_Layout_Options.zip
(20 KB)
443_Display_and_Presentation_Tips.zip
(179 KB)
444_WORKDAY_NETWORKDAYS_SEQUENCE.zip
(19 KB)
445_Column_and_Row_References.zip
(58 KB)
446_Accessibility.zip
(385 KB)
447_XLOOKUP_multiple_column_return.zip
(87 KB)
448_Charts_with_Filters_and_Slicers.zip
(47 KB)
449_SORT_and_SORTBY_functions.zip
(233 KB)
450_Navigation_Tools.zip
(494 KB)
451_Using_RANK_and_LET_functions.zip
(35 KB)
452_Conditional_Formatting_across_Rows.zip
(1008 KB)
453_PivotTable_Dates.zip
(150 KB)
454_TODAY_and_NOW_Functions.zip
(47 KB)
455_Freeze_and_Split.zip
(387 KB)
456_Rounding_functions_CEILING_and_FLOOR.zip
(11 KB)
457_Data_Bars.zip
(223 KB)
458_AutoSum_Tips.zip
(18 KB)
459_INDIRECT_Function.zip
(47 KB)
460_Custom_Lists.zip
(129 KB)
461_Split_Consolidate.zip
(36 KB)
462_Subtotals.zip
(182 KB)
463_Random_Functions.zip
(65 KB)
464_Ten_Quick_Tips.zip
(19 KB)
465_GROUPBY_and_PIVOTBY_Functions.zip
(241 KB)
466_Formulas_based_on_different_worksheets.zip
(16 KB)
467_Command_Locator.zip
(368 KB)
468_Check_Box.zip
(71 KB)
469_Paste_Values.zip
(425 KB)
470_Chart_Array_SORT_FILTER.zip
(43 KB)
471_Extract_data_from_picture.zip
(90 KB)
472_Custom_Views.zip
(70 KB)
473_PERCENTOF.zip
(22 KB)
474_Navigation_Pane.zip
(336 KB)
475_Shadow_Boxes.zip
(1.6 MB)
476_Updating.zip
(48 KB)
477_XLOOKUP_multiple_columns.zip
(95 KB)
478_Forecast_Tool.zip
(355 KB)
479_Default_Chart_Type_Chart Templates.zip
(23 KB)
480_Group_Pivot_Table_Fields.zip
(49 KB)
481_ISFORMULA_and_Formula_Auditing.zip
(47 KB)
489_Pivot_Table_Layouts.zip
(75 KB)
490_Flash_Fill.zip
(24 KB)
491_Cell_Protection_Schemes.zip
(192 KB)
492_Number_Formats.zip
(29 KB)
493_3D_Models.zip
(18.3 MB)
494_COUNT_COUNTA_COUNTBLANK_ISBLANK.zip
(46 KB)
495_PMT_and_FV_Functions.zip
(256 KB)
496_GROUPBY_Function.zip
(95 KB)
497_Check_Box_Conditional_Formatting.zip
(566 KB)
498_Time_Math.zip
(85 KB)
499_Alt_Key_Shortcuts.zip
(190 KB)
500_PIVOTBY_Function.zip
(51 KB)
501_Focus_Feature.zip
(733 KB)
502_Custom_Lists.zip
(134 KB)
503_Dragging_Techniques.zip
(139 KB)
504_TRIMRANGE_and_new_address_symbol.zip
(547 KB)
505_Shapes.zip
(125 KB)
506_XMATCH_and_INDEX.zip
(27 KB)
507_Files_Options_General_Settings.zip
(912 KB)
508_SEQUENCE_Function.zip
(472 KB)
509_Borders_Gridlines.zip
(318 KB)
510_Database_Functions.zip
(196 KB)
511_TAKE_Function.zip
(22 KB)
512_Hidden_Visible_Data.zip
(147 KB)
513_TRANSLATE_and_STCTLANGUAGE.zip
(31 KB)
514_PivotTable_Time_based_Grouping.zip
(599 KB)
515_FIND_MID_TEXTAFTER_TEXTBEFORE_Functions.zip
(27 KB)
516_2_digit_Year_Displays.zip
(403 KB)
517_Multi_worksheet_Formulas.zip
(17 KB)
518_Advanced_Filter.zip
(214 KB)
519_Titles_linked_to_Charts_and_Shapes.zip
(391 KB)
520_EOMONTH_EDATE.zip
(118 KB)
521_Analyze_Data.zip
(147 KB)
522_PageBreakPreview.zip
(327 KB)
523_Time_Math.zip.zip
(44 KB)
524_Chart_Efficiency.zip
(24 KB)
525_PivotTable_Consolidation.zip
(20 KB)
526_UNIQUE_and_FILTER_functions.zip
(91 KB)
527_TEXTSPLIT.zip
(27 KB)
528_List_and_Combo_Boxes.zip
(25 KB)
529_Information_Functions.zip
(36 KB)
530_Go_To_Special.zip
(240 KB)
531_Right_to_Left_Sorting.zip
(0 KB)
532_Auto_Outline.zip
(0 KB)
533_SWITCH_IFS_CHOOSE_Functions.zip
(0 KB)
534_Scenario_Manager.zip
(0 KB)
535_REPT_Function.zip
(0 KB)
536_Data_Validation_Prevent_Duplicates.zip
(0 KB)
537_WORKDAYINTL_and_NETWORKDAYSINTL_Functions.zip
(0 KB)
538_COPILOT_Function.zip
(0 KB)
539_Pick_List_XLOOKUP_Table_Chart.zip
(0 KB)
540_PivotTable_Dates_Metrics.zip
(0 KB)
541_TODAY_NOW_Date_Functions.zip
(0 KB)
542_In_Cell_Bar_Charts_with_Conditional_Formatting.zip
(0 KB)
543_TOCOL_TOROW_WRAPCOLS_WRAPROWS.zip
(0 KB)
544_Copilot_Feature.zip
(0 KB)
545_Accelerate_Data_Entry.zip
(0 KB)
546_Filter_Table_with_Slicers_and_AGGREGATE.zip
(0 KB)
547_Alter_Numeric_Data_without_Formulas.zip
(0 KB)
548_XLOOKUP_VLOOKUP_HLOOKUP_Approximate_lookups.zip
(0 KB)
549_Negative_Data_Bars_and_Conditional_Formatting.zip
(0 KB)
550_COPILOT_function_with_other_functions.zip
(0 KB)